A lot of people online, and I don’t mean just the “gurus,” get their jimmies rustled when you imply that trading is predicting.
They will say stuff like “I don’t predict, I react.”
Or, “I don’t predict, I trade based on statistical analysis of the markets.”
Or “I am playing the odds.”
Let’s cut the nonsense, it’s all the same thing.
What is a prediction? A prediction is when you think that one thing is more likely to happen than another thing.
Why do you take a long position? You do so because you think price is going to go up. After all, if you thought price was going to go down, why would you take a long position? You wouldn’t.
It doesn’t matter if you take a long position because you are “reacting” to something that makes you think price is more likely to rise, or because your “statistical analysis of the markets” suggests that in a certain scenario price is more likely to rise, you are still predicting that price is going to rise, and as a result you take a long position.
People don’t like to use the word “predict” because it ties into their ego. If they get a trade wrong, their ego takes a blow. Their prediction didn’t come true. That hurts.
But when they’re “just playing the odds” or whatever, it’s ok to have some losing trades.
All trading is predicting. Regardless of your reason for entering with a long position, whether it’s because you see a particular pattern, or you did statistical analysis, or your indicator gave a signal, or because you are “reacting” to a certain situation which has lead you to believe that price is more likely to go up than to go down, what do all of those situations have in common?
They all involve you thinking price is more likely to go up than to go down.
They all involve you predicting that price is more likely to go up than to go down.
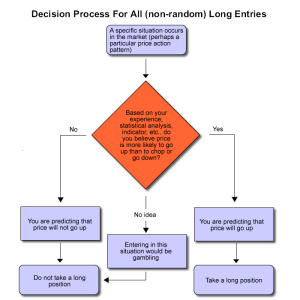
Here is a flow chart that explains the process for every single non-random long entry (random entries are not predictions; see the paragraph about random entries below):

(click to enlarge)
This is how every non-random long entry is made by every directional trader.
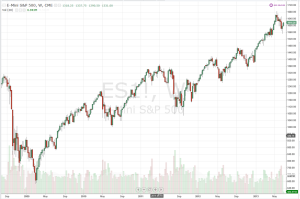
As you know, I frequently state that I cannot predict price direction, and that is why I trade the way I do. But even when I trade I am still predicting! I am predicting that the S&P will eventually go back up. I don’t know when, and I don’t know how far up it will go, but I am predicting that it will eventually go back up, and that’s why I average into my positions.
If I did not believe that the S&P was eventually going to go back up, I would not take a long position.
All trading is predicting. The reasons don’t matter. When you take a long position you are predicting that price is going to go up (after all, if you didn’t think price was going to go up, why would you go long?). When you take a short position you are predicting that price is going to go down (after all, if you didn’t think price was going to go down, why would you go short?).
Even if you use statistics you are still predicting. If you are going to flip a fair coin 100 times I will predict that you will get heads 50 times. If you are going to roll a six-sided die 60 times, I predict that you will roll a five 10 times.
If my statistical analysis tells me price is more likely to go up than to go down, I predict it will go up. If my statistical analysis tells me price is more likely to go down than to go up, I predict it will go down.
As for “reacting,” that’s the same thing, too. Trading “gurus” love to say they “react” rather than “predict,” as if you can’t be wrong with a “reaction.” But even that is all the same.
We’ve already established what a prediction is: a prediction is when you feel that one thing is more likely to happen than another thing.
When a trader “reacts,” what is happening? He sees a situation and feels that because of that situation, price is more likely to do one thing than to do something else. In other words, he is predicting that price is going to do something, and taking the appropriate position.
A “reaction” is a prediction of what will happen now. All predictions are reactions to the current situation.
The only way trading is not predicting is if your entries and your direction are random. If you flip a coin and heads means go long and tails means go short, that is the only situation in which trading is not predicting because you are entering randomly rather than because you think one outcome is more likely than another.
All (non-random) trading is predicting.
Hopefully your jimmies are unrustled now.


