Nice up day.
Maybe a bounce off this trend line?


Nice up day.
Maybe a bounce off this trend line?
Long 1,000 @ $132.
I know that’s a little below the original MAGIC FIB LINE but when I checked the charts today price had gapped down and was at 132 so I entered with a limit order.
Avg cost $132.70.
So the target profit is $137 which will bring approximate profit of $7,740.
Other alternatives if I’m feeling not so bullish:
– Sell 18 $133 covered June calls for $1.55 ($2,790 proceeds) + $540 profit if the calls are exercised.
– Sell 18 $135 covered June calls for for $0.72 ($1,296 proceeds) + $4,140 profit if the calls are exercised.
The options forum tells me I don’t want to sell covered calls too far out in the future because it’s not usually worth the extra premium.
Or I could always Sell 18 $137 covered June calls for $0.27 ($486 proceeds) which was my target profit anyway, so like an extra $486 less commissions?
Some of you may be drawing a down trendline here (see chart). No big deal, I’m just going to buy more if price goes down further.
It could also be argued that right now price is hitting a known R point.
But again, who cares, because price is random… at least to me. I sure can’t predict it!
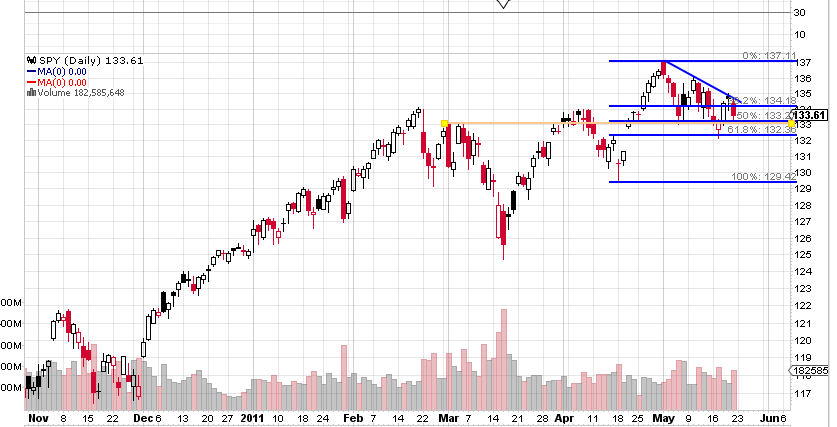
So what’s going on in this chart?
1) we’ve got the fib lines drawn
2) we’ve got a down trendline drawn (diagonal blue line)
3) we’ve got a known resistance point which may be flipping to S (orange line)
I wonder if any of the fib believers are going to look at the orange line and say “DOOD LOOK IT MATCHES ALMOST XACTLY WITH THE 50% FIB LINE!!!! SEE???? FIBS ARE MAGIC!!!!”
What does this mean for me?
It means nothing. The downtrend line means price should go down. The R becoming S means price should go up. But I cannot predict price, so I don’t even try to.
Look at this up day! Up about .65 cents total on the position so far which is like $520.
Target profit is currently around $137 which will put the profit at around $2,720 with the current amount of shares.
I should be using UPRO.
The next MAGIC FIB level is $132.44.
If price goes there before going up to the target profit, then the target price will net roughly $7,200.
Of course, since price is random, I have no idea where it’s going to go.
Lots of S around 133.30 (if you like S and R).
Long 600 shares at $133.32
OMG THAT ORDER WAS SO CLOSE TO THE LOW OF THE DAY!!! FIBS MUST HAVE MAGIC POWERS!!!
Seriously missed my entry by one cent yesterday. The low was $134.23. My entry as stated above is set at $134.22.
That order got filled today.
Long 200 shares SPY @ $134.22.
Entry point is $134.22
Getting close.
Order sitting to buy 200 shares of SPY @ $134.22.
This is real fibonacci trading. Not that vague BS that “gurus” charge you for with projections and lines all over the place and a bunch of runaround nonsense when you ask a question