Some of you may be drawing a down trendline here (see chart). No big deal, I’m just going to buy more if price goes down further.
It could also be argued that right now price is hitting a known R point.
But again, who cares, because price is random… at least to me. I sure can’t predict it!
So what’s going on in this chart?
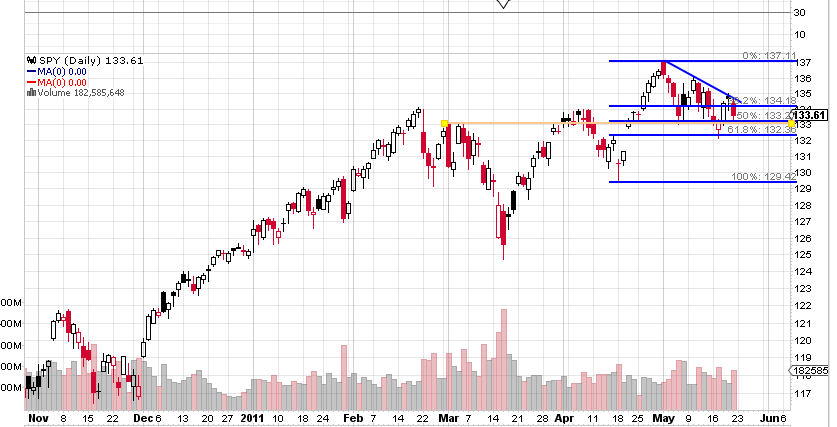
1) we’ve got the fib lines drawn
2) we’ve got a down trendline drawn (diagonal blue line)
3) we’ve got a known resistance point which may be flipping to S (orange line)
I wonder if any of the fib believers are going to look at the orange line and say “DOOD LOOK IT MATCHES ALMOST XACTLY WITH THE 50% FIB LINE!!!! SEE???? FIBS ARE MAGIC!!!!”
What does this mean for me?
It means nothing. The downtrend line means price should go down. The R becoming S means price should go up. But I cannot predict price, so I don’t even try to.