


I cannot predict price. I have tried for years. Every indicator, no indicator, price action, volume analysis, etc. I cannot predict price. When I accepted that price was random (it is to me), I changed my trading style and began to become profitable.
I trade with Fibonacci retracements. Let me state for the record that I do not believe they have any special predictive power. I do not believe that a 38.2% retracement is really any fundamentally different than 38.1% or 38.3% or any other number.
I do not believe Fibonacci numbers are special. I know that some people are pretty serious about using Fibonacci number tick or volume charts as if the Fibonacci number is somehow magic and will work better than any other number. That’s all nonsense.
When I first shared my method elsewhere a few years ago, the discussion quickly turned into an argument between people who think that because Fibonacci numbers may sometimes be found in nature, they are therefore applicable to trading, and the people who think that’s a bunch of crazy talk.
I decided to share this method because of a few conversations I had been having with people who were paying a monthly fee to some “guru” to learn how to trade with Fibonaccis. None of them were making any money (other than the “guru” who was collecting monthly subscriptions), and the thing I noticed is that these “gurus” were always extremely vague.
They would post after the fact charts where price happened to bounce off of a Fibonacci level and say “see?! Fibonacci retracements work!”
The gullible students would say “wow u r so smart! Here pleez take my money to teach me!”
But the people who had more accurate BS detectors see that that is all nonsense. Without knowing ahead of time if price was going to bounce off a Fibonacci level, and if so, which one, such a method is useless.
It’s just as useless as a “guru” who “teaches” how to use MACD and only posts after the fact trades where MACD happened to show a profitable trade, and ignores all the trades where MACD didn’t work without telling you how you are supposed to know at the time that that trade wouldn’t work out. When asked “what about this other trade where all your conditions were met and the trade would’ve been a loser, but you didn’t seem to take that trade. Why not?” they will reply with some vague nonsense that doesn’t even answer the question. btw, this stuff is all Scammy Guru 101 so keep your eyes peeled.
I decided that I would present a method, for free, about how to trade with Fibonaccis. I called it “The Only Way To Trade With Fibonaccis.” The premise is that if you want to trade with Fibonaccis, and you don’t have to, but if you want to, this is how you do it.
All entry points are laid out ahead of time.
The target profit is laid out ahead of time.
The stop loss is laid out ahead of time.
There’s no vagueness. No ambiguity. No nonsense. No “guru” nonsense like on an after the fact chart when a trade sort of goes in his favor for a little while and then reverses for what would’ve been a big loss, and he says “well you could’ve taken up to x points of profit here for a quick scalp” but in real time he had no idea how far it would go or when to take profits. Double lol if he promotes himself as a “trend trader” and then tells you that the trade in question would’ve been a profitable scalp. Remember, he had no idea in real time that the trade would need to be a scalp (read: cut short) to be profitable, he’s just trying to seem smart after the fact so his students keep paying him to teach them which is the way he makes money since obviously he doesn’t actually trade profitably.
You may have heard the saying that “95% of traders lose.”
You may also have heard the “rules” that people like to share as if they are the golden rules of trading. Things like:
– never add to a losing position
– never let a winner turn into a loser
– never risk more than 2% of your account
– the trend is your friend
Well, it seems like 95% of people are following those rules, and losing.
I don’t follow any of them.
1) I regularly add to losing positions
2) My winners sometimes turn into losers on the way to wherever they are going, the target profit or the stop loss
3) My drawdown sometimes gets well beyond 2% of my account
4) Every entry I make is counter-trend
And sometimes I will also be long and short at the same time (for example, SPY and SH at the same time).
The basis for my method is as follows:
– Price is random (note: price may not be random, but I cannot predict it, and I have not seen anyone else who can, either. I’ve seen lots of snakeoil salesmen with really nice after the fact charts, but I’ve never seen anyone do it in real time).
I have posted long journal threads with realtime calls for both intraday trading on the ES as well as longer term trading on SPY (and SH) and QLD (double weighted NASDAQ).
The intraday method is as follows:
Draw Fibonacci retracements:
– add 1 contract at the 38.2% retracement
– add 3 contracts at the 50% retracement
– add 5 contracts at the 61.8% retracement
Exit is 0%.
Stop loss is 100%.
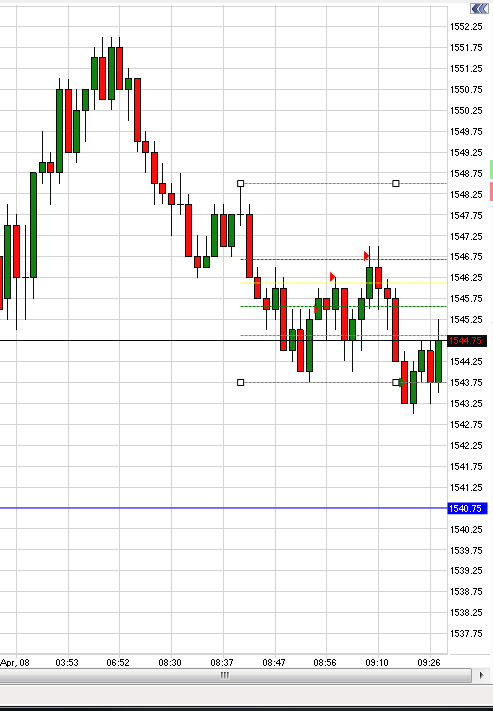
Here’s an example from this morning:
Short 1 ES @ 1545.50 (this was supposed to be 1545.75 but I clicked the wrong level on the chart)
Short 3 ES @ 1546.25
Short 5 ES @ 1546.75
Target profit: 1543.75
Stop loss: 1548.50
Target profit hit.
The longer term trading method is similar, but I don’t use a hard stop loss at the 100% line because when trading longer term I’m not using leverage like during intraday so there’s no need to limit the loss at the 100% retracement. I continue to add to the position as it goes against me past the 100% retracement level, and in this case I will sometimes change the profit target to a level below the 0% retracement if price goes below the 100% retracement level.
In one of my long term journal threads I had a SPY position that I started in May 2011 that went well below my original 100% line. As price went lower over the next few months I was buying more. At one point I was drawn down around $60k. People were posting in the thread that I should close my position and my risk/reward was all wrong and blah blah blah. While I was drawing down the position, I was making money by trading SH on the other side and also collecting SPY dividends. When price reversed and went back up, the net profit when I closed the trade on October 27, 2011, was over $41k. About $31k was SPY, $9,000 was from closed hedge positions with SH, -$3,200 was from the currently open SH position, $4,600 was from dividends. Here’s the actual breakdown of the trade on November 1, 2011 (after the final dividend was paid):
SPY: $31,115.00 (closed)
hedge: -$3,281 (closed)
$27,834.00 (SPY gain + open hedge loss)
$1,223.60 (realized hedge gain)
$2,931.69 (realized hedge gain)
$1,129.72 (dividend)
$3,562.22 (dividend)
$5,221.55 (realized hedge gain)
————————
$41,902.78 (total for trade)
You can go to that site and view the thread if you want. That site doesn’t allow you to edit past entries so you can view it day by day, trade by trade if you want.
Is this the best style of trading? Definitely not. Because I have to start with a small position, long, slow uptrends are really boring and don’t result in much profit. To give you an example, in November 2012 I opened a long QLD position that today, 5 months later, is hovering around $1,400. Now to be fair, QLD has basically been going in a horizontal line since I opened the position, and I had no idea that was going to happen, but sometimes it just takes a lot of patience.
Of course, if I could predict price I would just enter in the correct direction with my entire account. Since I cannot do that, I have to trade this way.