Silver Reversed Exactly At A Fibonacci Level!

Look at this one!  Price reversed exactly at the 0.764 Fibonacci level!  Now, I didn’t even know that was a Fibonacci level, but it seems to have called the exact bottom.

silver fibonacci reversal
Unfortunately I don’t think anyone knew ahead of time that this particular Fibonacci level would be the one where price reversed (why here and not 0.618, or 0.5, or 0.382?), and I’m sure none of the fib “gurus” that people actually pay money to to learn how to trade made this prediction.

It’s funny how Fibonacci lines only seem to work sometimes and no one knows ahead of time which one will work.

It’s almost as if Fibonacci levels in trading are complete nonsense.

All Trading Is Predicting

A lot of people online, and I don’t mean just the “gurus,” get their jimmies rustled when you imply that trading is predicting.

They will say stuff like “I don’t predict, I react.”

Or, “I don’t predict, I trade based on statistical analysis of the markets.”

Or “I am playing the odds.”

Let’s cut the nonsense, it’s all the same thing.

What is a prediction?  A prediction is when you think that one thing is more likely to happen than another thing.

Why do you take a long position?  You do so because you think price is going to go up.  After all, if you thought price was going to go down, why would you take a long position?  You wouldn’t.

It doesn’t matter if you take a long position because you are “reacting” to something that makes you think price is more likely to rise, or because your “statistical analysis of the markets” suggests that in a certain scenario price is more likely to rise, you are still predicting that price is going to rise, and as a result you take a long position.

People don’t like to use the word “predict” because it ties into their ego.  If they get a trade wrong, their ego takes a blow.  Their prediction didn’t come true.  That hurts.

But when they’re “just playing the odds” or whatever, it’s ok to have some losing trades.

All trading is predicting.  Regardless of your reason for entering with a long position, whether it’s because you see a particular pattern, or you did statistical analysis, or your indicator gave a signal, or because you are “reacting” to a certain situation which has lead you to believe that price is more likely to go up than to go down, what do all of those situations have in common?

They all involve you thinking price is more likely to go up than to go down.

They all involve you predicting that price is more likely to go up than to go down.

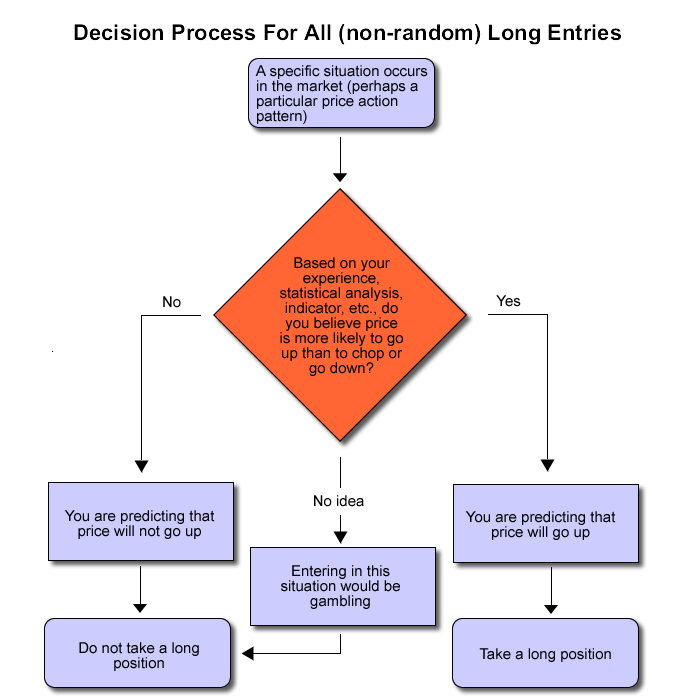
Here is a flow chart that explains the process for every single non-random long entry (random entries are not predictions; see the paragraph about random entries below):
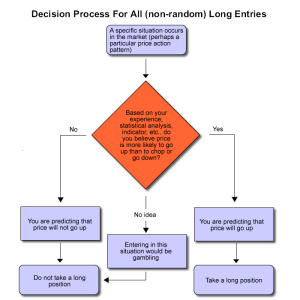
long flow chart

(click to enlarge)
This is how every non-random long entry is made by every directional trader.

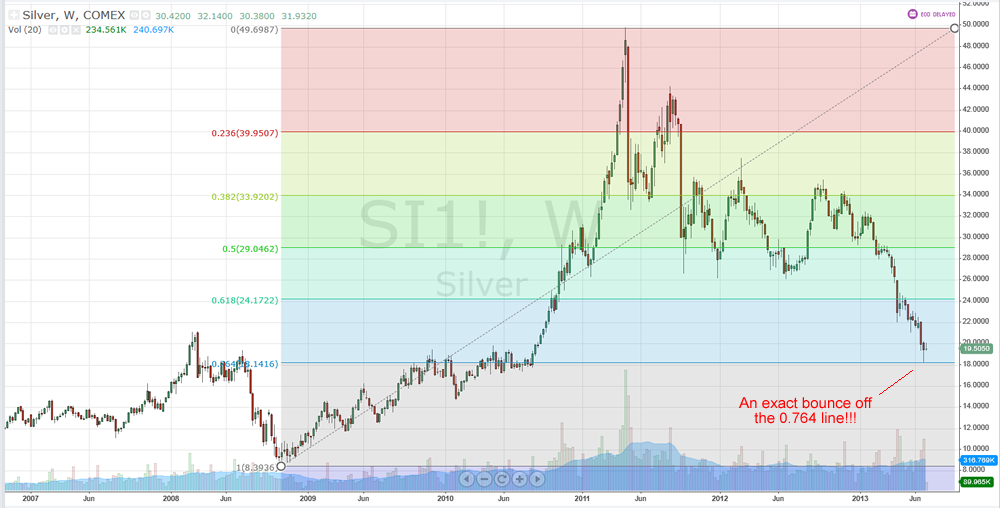
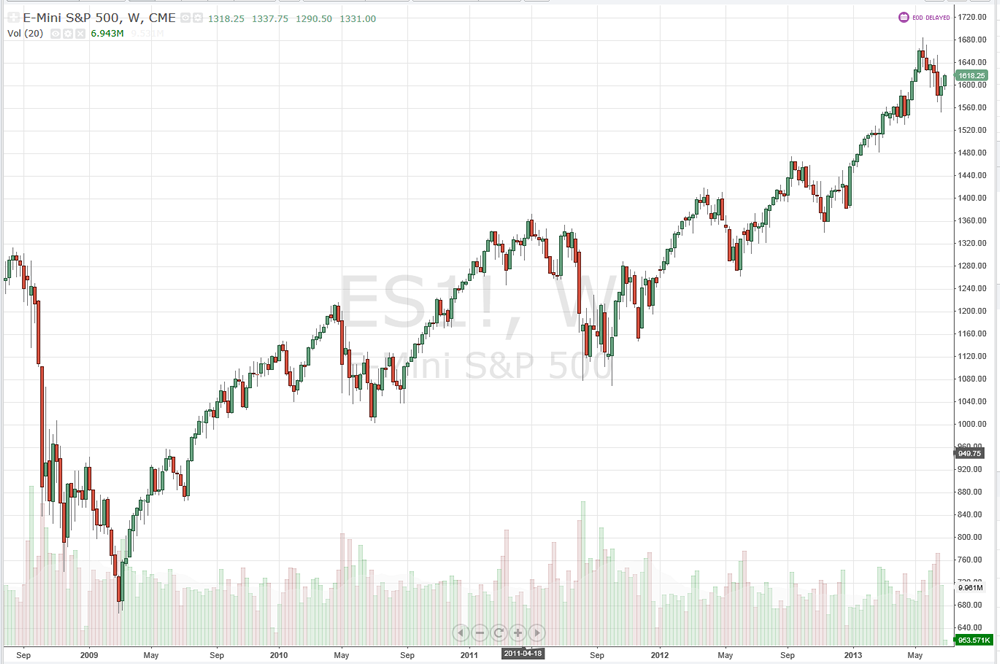
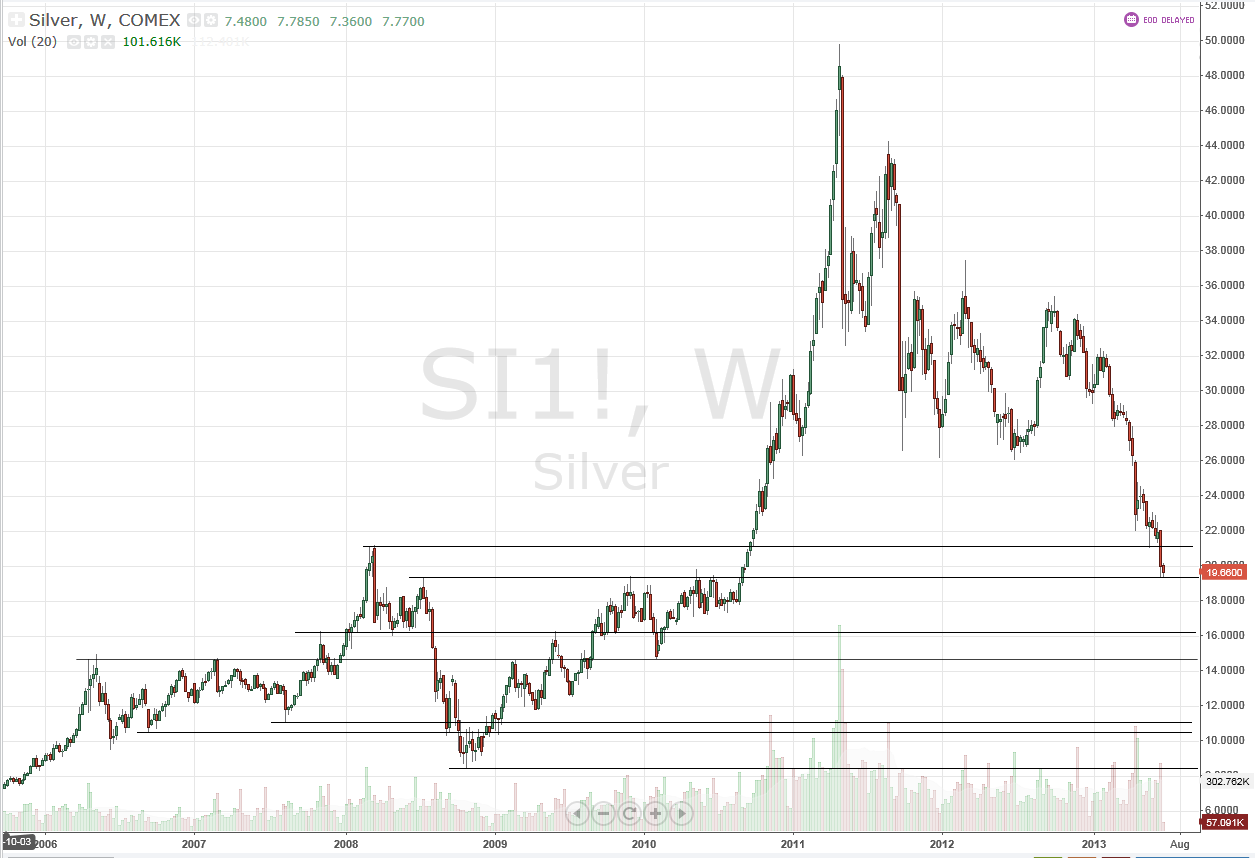
As you know, I frequently state that I cannot predict price direction, and that is why I trade the way I do.  But even when I trade I am still predicting!  I am predicting that the S&P will eventually go back up.  I don’t know when, and I don’t know how far up it will go, but I am predicting that it will eventually go back up, and that’s why I average into my positions.

If I did not believe that the S&P was eventually going to go back up, I would not take a long position.

All trading is predicting.  The reasons don’t matter.  When you take a long position you are predicting that price is going to go up (after all, if you didn’t think price was going to go up, why would you go long?).  When you take a short position you are predicting that price is going to go down (after all, if you didn’t think price was going to go down, why would you go short?).

Even if you use statistics you are still predicting.  If you are going to flip a fair coin 100 times I will predict that you will get heads 50 times.  If you are going to roll a six-sided die 60 times, I predict that you will roll a five 10 times.

If my statistical analysis tells me price is more likely to go up than to go down, I predict it will go up.  If my statistical analysis tells me price is more likely to go down than to go up, I predict it will go down.

As for “reacting,” that’s the same thing, too.  Trading “gurus” love to say they “react” rather than “predict,” as if you can’t be wrong with a “reaction.”  But even that is all the same.

We’ve already established what a prediction is: a prediction is when you feel that one thing is more likely to happen than another thing.

When a trader “reacts,” what is happening?  He sees a situation and feels that because of that situation, price is more likely to do one thing than to do something else.  In other words, he is predicting that price is going to do something, and taking the appropriate position.

A “reaction” is a prediction of what will happen now.  All predictions are reactions to the current situation.

The only way trading is not predicting is if your entries and your direction are random.  If you flip a coin and heads means go long and tails means go short, that is the only situation in which trading is not predicting because you are entering randomly rather than because you think one outcome is more likely than another.

All (non-random) trading is predicting.

Hopefully your jimmies are unrustled now.Rustled Jimmies

How To Determine The Trend In Real Time

Where did the up trend begin in this chart?

ES weekly chart

Where did the up trend begin on this chart? Click to enlarge.

We can all look at that and see that price is in an uptrend, but when exactly did you know it was in an up trend?  If you cannot pinpoint the specific bar at which you determined “now we are in an uptrend,” then your method of determining the trend is useless in real time.

I have seen three (well, four, technically) definitions for how to determine a trend:

1) a series of HH/HL.  Depending on who you talk to, the number of points required varies, but it’s generally at least one HH/HL to determine an uptrend.

2) the slope of an MA.  This one is pretty self-explanitory although obviously results may differ based on the length of MA used.

3) S becoming R (or vice versa).  This one works great when it works, but often price rallies upward for a long time without ever bouncing off of a previous R point, in which case this method would not identify the trend.

4) indicator stuff.  The slope of an indicator, or an indicator crossing a certain level, or a fast line crossing over a slow line, etc.  I don’t really count this as a separate category though because all indicators like these are just showing you what price is doing now compared to what it did a certain number of bars ago.  They aren’t providing new information.

Those are the three (four) methods I’ve seen.

To determine a trend in real time you have to be able to reach a point in real time when you say “now that this most recent bar (or tick) has printed, a new trend has been established.  Prior to this current bar (or tick) printing, the trend was either the opposite direction or unknown (chop).”

If you cannot make that statement, or if the person who is supposedly teaching you how to trade cannot make that statement, then your “trend analysis” is useless.  Anyone can look at a historical chart and determine the trend, but that’s not going to help you trade today.

Also, once you determine the trend, what makes price more likely to keep going in that direction?  People love to say things like “the trend is your friend until the end.”  Well looking at a chart in hindsight, of course you can see big trends and areas of congestion.  But let’s say you have now determined the direction of the trend because you have a method of quantifying the trend that allows you to say “as of right now I have established that we are in an uptrend whereas prior to right now the trend was either going in the other direction or price was chopping.”  After you determine the trend, what makes price more likely to keep going in the current direction?  How do you know you aren’t buying the top?

It is quite possible that there is no such thing as a “trend” in real time and they only exist in hindsight.

So once the trend is established, the next point becomes determining when to enter.  And that’s another topic for another day.

USLV Reverse Split

Over the past month and a half, USLV has fallen over 50%.

If silver drops approximately another 33%, USLV will be at 0.

If silver drops 50% USLV will be negative.

Do you think a reverse split will happen?

If silver recovers this will represent a huge investment opportunity.  Or maybe the recent highs were crazy and silver is going to go back down to $5 and stay there.  How do you think the world’s economy will be affected if that happens?

USLV weekly


How Low Is Silver Going To Go?

As you know, I’ve been watching (and buying) silver since it began falling in April.  As of right now it is trading at $19.66.

Here is a chart of sliver with some previous support and resistance lines marked on it.  Perhaps one of these will play a role in the future since sometimes price likes to bounce off previously established levels, which you can see has already happened a few times here.

Or maybe it will reverse at a level that hasn’t been support or resistance yet.

Or maybe it will keep going down through all of these levels without reversing.

silver weekly chart

“Sell In May And Go Away?” LOL

The ES has continued to go up since May began.  The last few candles are sort of hammers, and aren’t hammers supposed to be bullish?  So maybe it will keep going up.

ES in May

I will start buying when price starts going down, and as always I will post all my trades in real time both here and on Twitter.

May 21, 2013 – USLV Update

A few hours after I made the post about silver dropping to new lows, it spiked up!

big silver spike

I had an order sitting to buy 800 shares of USLV @ $7.92 and it didn’t get filled because USLV only got down to $7.95.

If my order had been at $7.95 instead and had gotten filled I would now have 1,385 shares of USLV with an average cost of $8.64 and with USLV currently at $9.21 I would be up $796.  However, since that order was not filled, my position remains at 585 shares with an average cost of $9.57 and is currently down $212.

My order for $7.92 is still open.

Silver Dropped To New Lows Last Night

Here is a 60 minute chart of silver.  I highlighted afterhours trading in grey, and regular trading hours in black.  You can see silver does most of its movement afterhours which limits your options when trading silver ETFs like SLV, ACQ (2x weighted silver) and USLV (3x weighted silver) because they only trade on the stock market during regular hours.

silver May 19th

Look at how low it was shortly after trading began on the night of Sunday, May 19th (times in that chart are CST).

This would’ve likely made USLV drop down to below $7/share if it had been trading at the time.  I had hoped prices would remain that low but as you can see, as soon as silver made its low of $20.250 it immediately started going back up again, and when regular trading hours began today was trading around $21.500 and as a result USLV opened at $8.00.

There’s No Such Thing As A “Trend”

How many times have you heard “the trend is your friend”?

Ask 10 traders how they define the trend and you’ll get 10 different answers.  Let’s go over some of the common ones:

1) The trend is a series of HHs and HLs.  Really?  How many?  What if there’s a LL somewhere in there?  That happens all the time.  It also assumes that if there are HHs and HLs that price will continue to keep making HLs.

not an uptrend

Not an uptrend


2) The trend is determined by the slope of a moving average.  Sometimes you will also hear this as “the trend is determined based on whether price is above or below a MA.”  These are the same thing because with almost every time of MA, if price is above it then the moving average is going up, and if price is below it than the moving average is going down.  The only exceptions to this are some of the stranger moving averages that use weird calculations and also sometimes you might get a calculation error depending on the software you use if there is not enough data (like if you  scroll all the way to the left of your chart), but this is all beside the point.  In any of these cases, the “trend” will then be based on the moving average type and period you chose.  Some people think a 20 period EMA (exponential moving average) is significant.  Some people think a 200 period SMA (simple moving average) is significant.  But your 200 SMA might be going up and the 20 EMA might be going down.  Then were is your trend?

wheres the trend

Where’s the trend?

3) Based on some indicator.  Don’t even get me started on this one.

Trends only exist in hindsight.  You can look at a chart and tell if price was trending up, trending down, or chopping.  But in real time you cannot tell.  How do you know where the trend begins?  How do you know that once you say “ok, we’re in a trend now” price isn’t going to immediately reverse and go back down the opposite way?

big uptrend

This is obviously an uptrend but we only know that in hindsight.

Check out that chart of SPY.  It’s obviously an uptrend, but did you know in March that it was going to keep going up?  What about now?  Is it going to keep going up?  It’s in an uptrend so it should keep going up, right?

Have you ever met a profitable trend trader?  I’ve seen lots of people selling courses and books about trading with the trend but I’ve never seen any of them make real time calls and be profitable.

Sometimes people will try to apply the laws of physics to the market.  You’ve heard the saying that “an object in motion remains in motion, and at a constant velocity, unless acted upon by a force.”  They’ll use that same saying to try and explain why trends exist in the market.  lol.  I mean, I guess a change in supply and demand could be “a force” that will change the motion of the market, but without knowing when that will happen, it doesn’t do us any good.  Look at that SPY chart again.  It’s been going up for a while.  Is it going to keep going up?  When is that force going to come?  I have no idea.  Neither does anyone else.

A “trend” can only be a real thing if a) you can define it, for example “one bar ago we were not in a trend but because price did a certain thing, as of this current bar we are now in a trend,” and b) that actually has any significance on its future behavior, for example, “because price is now in a trend (although it wasn’t one bar ago), it will now continue to go in the same direction.”

If you can define a trend in real time and use that to trade profitably, then keep on doing what you’re doing.

Higher High? Higher Low? Lower Low? Lower High?

Some people will tell you that trends “move in waves.”  They will say, for example, that up trends are made of a series of higher highs and higher lows, like this:

uptrend

And a downtrend is just the opposite (a series of lower lows and lower highs).

downtrend

Now that’s cool and it makes sense, but there are two other things price can do: make double tops and double bottoms (when a high is the same as a previous high and when a low is the same as a previous low):

double tops and bottoms

As far as this kind of price action is concerned, those are all the possibilities you can have.

Conventional thinking will tell us that higher lows, for instance, are bullish because they mean price was unable to break the previous low before going back up.

Double tops are likely to be bearish because it means price was unable to break above the previous high (and you could also look at it as price bouncing off of previous resistance, which is bearish).

Double bottoms are likely to be bullish because it means price was unable to go beneath the previous low (and you could also look at it as price bouncing off of previous support, which is bullish).

Now, is this enough off of which to build a trading system?

There are a few problems with this.  Let’s say you were going to trade an uptrend that was formed by HHs and HLs.  Price starts going up and forms a high, and then it starts retracing.

uptrend forming 1

You are going to wait for the HL and then go long, but there is a problem: how do you know when price is done retracing and is going to go back up?  How do you know that retrace isn’t going to keep going down and form a lower low?

uptrend forming 2

Did you enter yet?

uptrend forming 3

Did you enter yet?

uptrend forming 4

Did you enter yet?

uptrend forming 5

Oh no, price formed a lower low!  Looks like we’re not in an uptrend anymore.

Now we should be looking for a lower high to confirm the downtrend, right?

uptrend forming 6

A LL followed by a HH?!  How does that happen?!

People will come up with all sorts of rules, like:

– don’t enter long until a high, a HL, and another HH (this is supposed to “confirm” the uptrend)

– don’t enter long after more than 3 waves (as if after making 3 HHs, price won’t make another HH)

All of these rules are just things people make up because they don’t understand the random price of the market.

Sometimes price trends and makes beautiful HHs, HLs, and HHs.  If you can figure out when to enter (because the HL can form at any point), you can make money as long as you get out before price goes against you.  Be careful adding to winning trades because as soon as that retracement goes a bit too far, your winning trade can turn into a losing trade.

Sometimes price makes LL, HH, LL.

Sometimes price makes HL, LH, HL.

Price can do whatever it wants and doesn’t care what it has done in the past.

You will see people chime in on these kinds of discussions and say “well obviously you just don’t understand it” subtly implying that they do understand it, yet you will never see them make real time calls.  I wonder why?

Price can go wherever it wants, and unless you know ahead of time that it’s going to make a LH or whatever, there’s no way to know that a HL will follow a HH.  Here is a list of possible formations that can follow a HH:

– HL

– DB

– LL

(obviously a LH can’t follow a HH because a LH is formed when price is rising and if you’re already at an HH you can’t have a LH without some sort of low coming first).

Here’s a chart showing what can follow what.  Start with the vertical column and go across to see if a certain formation can follow it.

high low table

This is a very active topic and I will likely revisit it in the future.

I encourage your comments and discussion about how to use HH/HL/LL/LH/DB/DT in your trading.