


Take a look at this chart. I’ve labeled some of the technical patterns that you might identify:
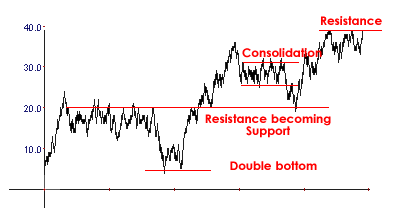
You can see a double bottom as price tests support and then rallies up to a previous level of resistance.
You can see price bounce off that previous resistance and then continue upward, and then come down and retest that same level, bounce off as it flips to support, and then continue upward again.
You can see a period of consolidation after a new high where it just kind of chops around for a bit, then breaks through to the bottom, bounces off that new support level, goes back up and is currently forming a triple top at a new resistance level.
A trader armed with this knowledge who can identify these patterns should be able to make some money, right?
Well, I hate to tell you this, but this is just a random chart that was generated by 1,000 coin flips. Heads is +1, tails is -1. The only change I made was to move it over to the left a little bit so it didn’t start from zero, since no stock ever starts from zero.
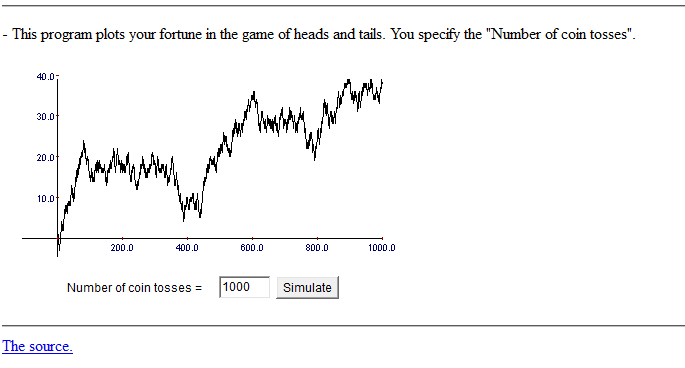
You can try it yourself here. Obviously some of the results won’t look like stock charts, especially the ones that go negative, but run it a few times and you should get some good ones.
Are you being fooled by randomness?