As you know, I trade by adding to my position when price goes against me.
Most people say you’re not supposed to do that. Here is where I point out that when I add to my position, I do it with specific risk tolerances rather than haphazardly adding as long as price keeps going down, which is a good way to lose all your money.
Adding to a position brings the average cost closer to the most recent add. For example, if I go long ES at 1,000 with 1 contract and then price decreases to 995 and I add another contract, my average price is now 997.50, which is closer to the most recent add. The more you add to an open position, the more price moves closer to the most recent add. For example, if I have one ES contract long at 1,000 and price decreases to 995 and I add 2, my average cost is now 996.66, which is closer to the most recent add than it was when I only added 1.
When you add to a losing long position, your average cost decreases which means it only takes a smaller movement for your trade to turn into a winner.
But when you add to a winning position, that means it takes a smaller move against you for your position to turn into a loser.
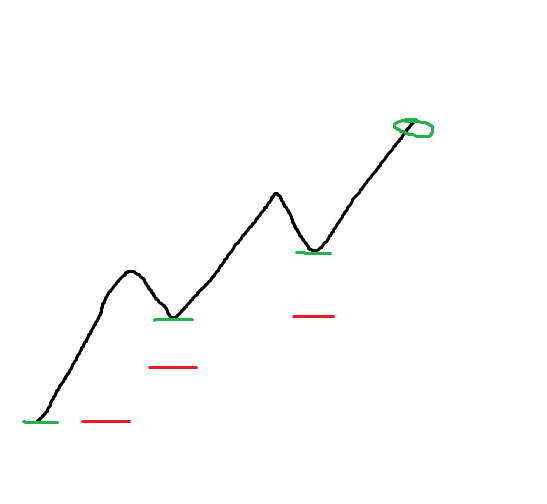
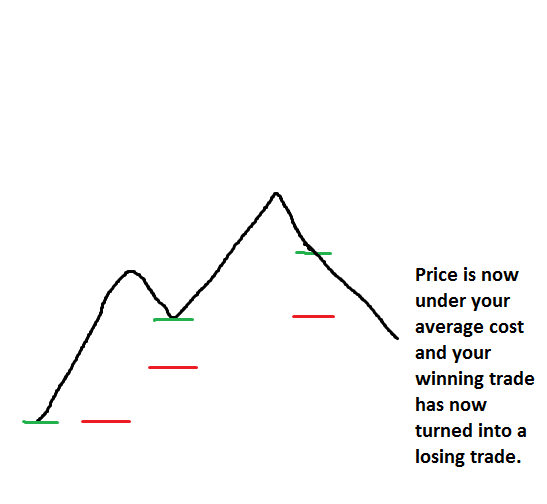
Let’s assume price is trending upward and is making a few pullbacks along the way, making HHs (higher highs) and HLs (higher lows). If you were long at the start of the trend and then added to your position at each pullback, it would look like this:
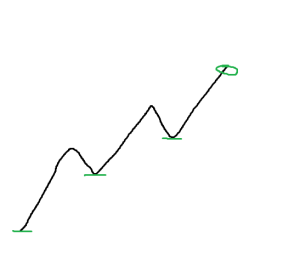
That is an ideal situation, but let’s assume for now that that’s what happens.
The green lines are buys and the green circle is selling your entire position.
If you could trade like this, you’d have a nice winning trade.
But let’s look at what is happening. When you first open the position, your average cost is right at the first entry point. No problem.
When you add the second contract, your average cost has now risen.
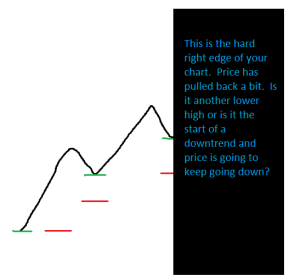
The red dash shows where your average cost is after each add (this assumes you start with one contract and add one contract at each buy level):

Now that’s fine and all if price keeps going up, but what if it doesn’t?
How do you know that each of those pullbacks is just going to be a LH and that price isn’t going to keep going down? When you’re looking at the hard right edge of the chart, can you tell?
If price doesn’t keep going up and instead keeps going down, your previous winning trade has just turned into a losing trade:
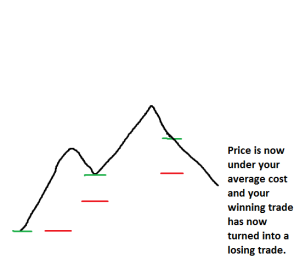
In that last situation, if you hadn’t added to your winning trade, it would still be a profitable trade as price is still above your initial entry point (and average cost).
Adding to winning trades is only profitable if price keeps going in your direction, and a small movement against you can turn your winner into a loser.
I’m not saying it’s wrong. If you can make it work for you then you should keep doing it. I’m just explaining why I don’t add to winners. Since I cannot predict direction, I have no idea if that pullback is going to be a pullback as part of a bigger trend or if it’s the beginning of a bigger movement in the opposite direction which would turn my winning trade into a losing trade. I have also never seen anyone who can tell in real time if a pullback is a LH or the beginning of a downtrend. I’ve seen a lot of gurus post after the fact charts where everything looks all perfect, but I’ve never seen a single one make a real time call. In fact, this is a good way to tell if someone who claims to be a trading instructor is scamming you or not. If they only show you after the fact charts and cannot demonstrate in real time that they can trade profitably, then they are probably scamming you. If they show a chart and say “add here on the pullbacks” without explaining how they knew they were just pullbacks and not the beginning of trends in the opposite direction, they are scamming you.
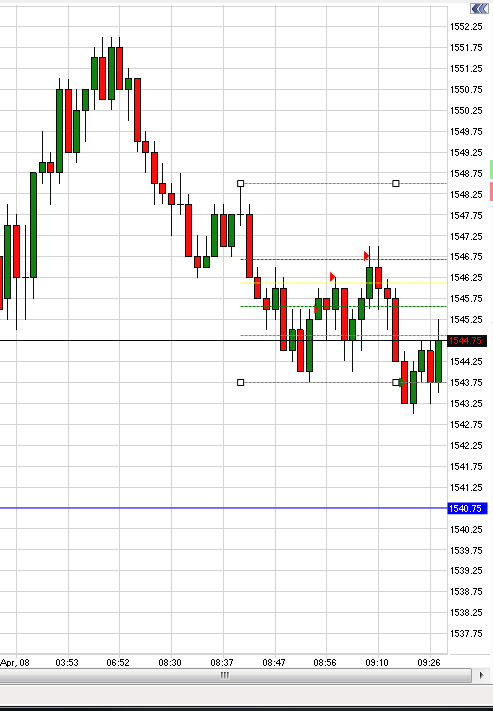
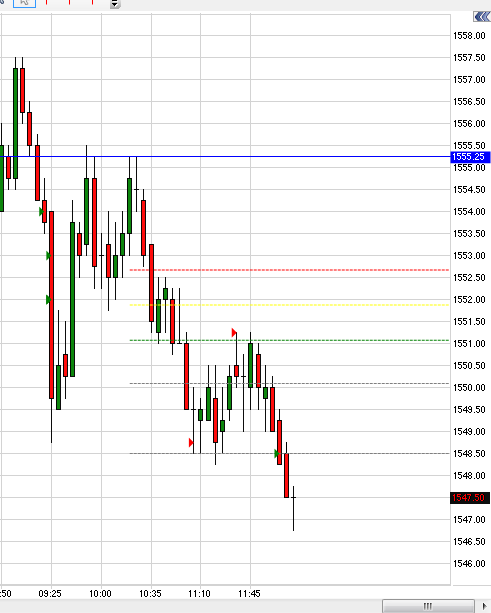
Refer back to this image:
When you’re in that position, can your “guru” trade instructor teach you how to tell if that’s going to be a pullback (in which case you should buy) or if it’s the beginning of a down trend (in which case you should not buy)?
Sure, he can post after the fact charts like the first one I posted in this entry, but after the fact charts don’t help you.