How many times have you heard “the trend is your friend”?
Ask 10 traders how they define the trend and you’ll get 10 different answers. Let’s go over some of the common ones:
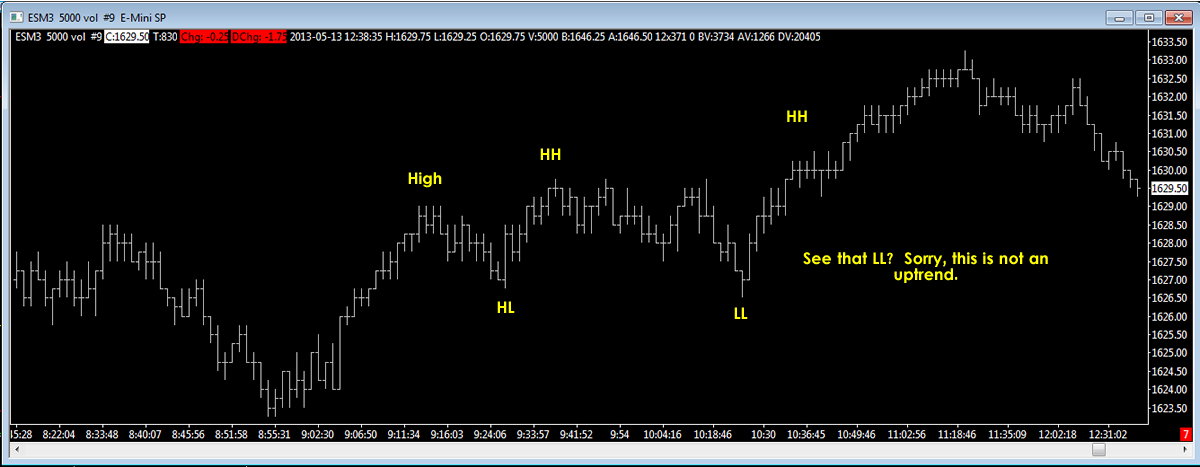
1) The trend is a series of HHs and HLs. Really? How many? What if there’s a LL somewhere in there? That happens all the time. It also assumes that if there are HHs and HLs that price will continue to keep making HLs.

Not an uptrend
2) The trend is determined by the slope of a moving average. Sometimes you will also hear this as “the trend is determined based on whether price is above or below a MA.” These are the same thing because with almost every time of MA, if price is above it then the moving average is going up, and if price is below it than the moving average is going down. The only exceptions to this are some of the stranger moving averages that use weird calculations and also sometimes you might get a calculation error depending on the software you use if there is not enough data (like if you scroll all the way to the left of your chart), but this is all beside the point. In any of these cases, the “trend” will then be based on the moving average type and period you chose. Some people think a 20 period EMA (exponential moving average) is significant. Some people think a 200 period SMA (simple moving average) is significant. But your 200 SMA might be going up and the 20 EMA might be going down. Then were is your trend?
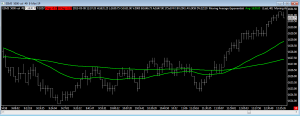
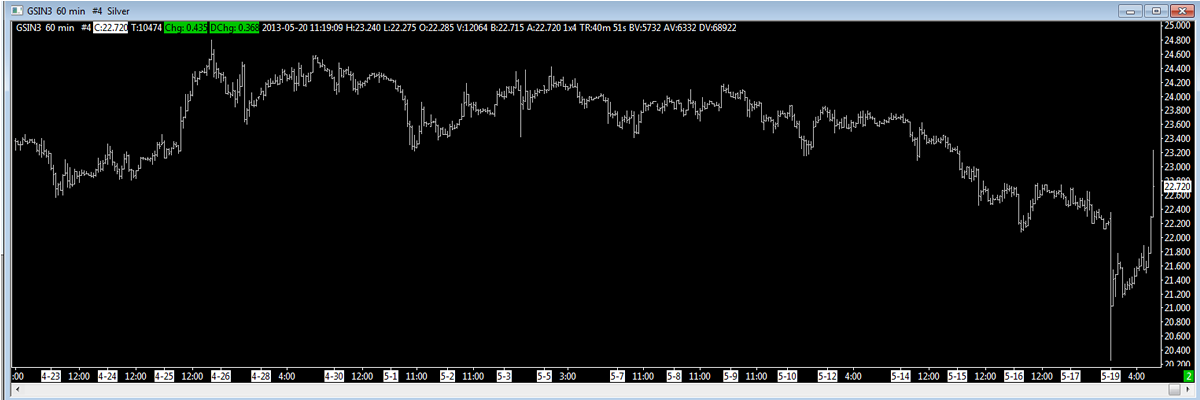
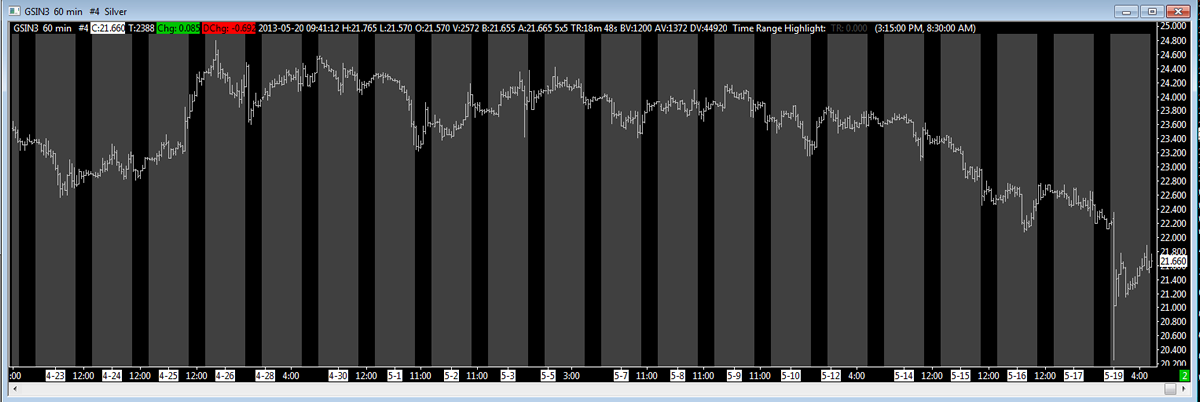
Where’s the trend?
3) Based on some indicator. Don’t even get me started on this one.
Trends only exist in hindsight. You can look at a chart and tell if price was trending up, trending down, or chopping. But in real time you cannot tell. How do you know where the trend begins? How do you know that once you say “ok, we’re in a trend now” price isn’t going to immediately reverse and go back down the opposite way?

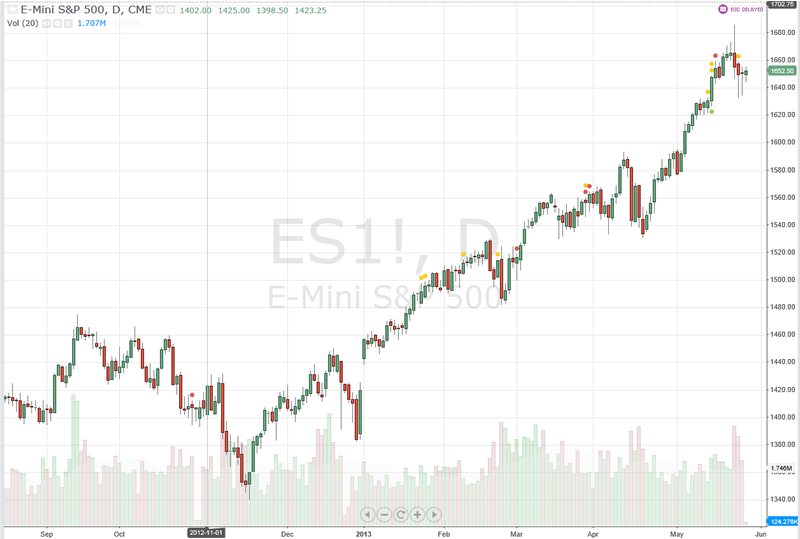
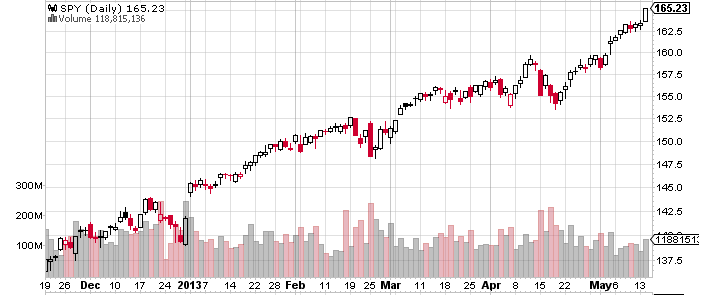
This is obviously an uptrend but we only know that in hindsight.
Check out that chart of SPY. It’s obviously an uptrend, but did you know in March that it was going to keep going up? What about now? Is it going to keep going up? It’s in an uptrend so it should keep going up, right?
Have you ever met a profitable trend trader? I’ve seen lots of people selling courses and books about trading with the trend but I’ve never seen any of them make real time calls and be profitable.
Sometimes people will try to apply the laws of physics to the market. You’ve heard the saying that “an object in motion remains in motion, and at a constant velocity, unless acted upon by a force.” They’ll use that same saying to try and explain why trends exist in the market. lol. I mean, I guess a change in supply and demand could be “a force” that will change the motion of the market, but without knowing when that will happen, it doesn’t do us any good. Look at that SPY chart again. It’s been going up for a while. Is it going to keep going up? When is that force going to come? I have no idea. Neither does anyone else.
A “trend” can only be a real thing if a) you can define it, for example “one bar ago we were not in a trend but because price did a certain thing, as of this current bar we are now in a trend,” and b) that actually has any significance on its future behavior, for example, “because price is now in a trend (although it wasn’t one bar ago), it will now continue to go in the same direction.”
If you can define a trend in real time and use that to trade profitably, then keep on doing what you’re doing.