Higher High? Higher Low? Lower Low? Lower High?

Some people will tell you that trends “move in waves.”  They will say, for example, that up trends are made of a series of higher highs and higher lows, like this:

uptrend

And a downtrend is just the opposite (a series of lower lows and lower highs).

downtrend

Now that’s cool and it makes sense, but there are two other things price can do: make double tops and double bottoms (when a high is the same as a previous high and when a low is the same as a previous low):

double tops and bottoms

As far as this kind of price action is concerned, those are all the possibilities you can have.

Conventional thinking will tell us that higher lows, for instance, are bullish because they mean price was unable to break the previous low before going back up.

Double tops are likely to be bearish because it means price was unable to break above the previous high (and you could also look at it as price bouncing off of previous resistance, which is bearish).

Double bottoms are likely to be bullish because it means price was unable to go beneath the previous low (and you could also look at it as price bouncing off of previous support, which is bullish).

Now, is this enough off of which to build a trading system?

There are a few problems with this.  Let’s say you were going to trade an uptrend that was formed by HHs and HLs.  Price starts going up and forms a high, and then it starts retracing.

uptrend forming 1

You are going to wait for the HL and then go long, but there is a problem: how do you know when price is done retracing and is going to go back up?  How do you know that retrace isn’t going to keep going down and form a lower low?

uptrend forming 2

Did you enter yet?

uptrend forming 3

Did you enter yet?

uptrend forming 4

Did you enter yet?

uptrend forming 5

Oh no, price formed a lower low!  Looks like we’re not in an uptrend anymore.

Now we should be looking for a lower high to confirm the downtrend, right?

uptrend forming 6

A LL followed by a HH?!  How does that happen?!

People will come up with all sorts of rules, like:

– don’t enter long until a high, a HL, and another HH (this is supposed to “confirm” the uptrend)

– don’t enter long after more than 3 waves (as if after making 3 HHs, price won’t make another HH)

All of these rules are just things people make up because they don’t understand the random price of the market.

Sometimes price trends and makes beautiful HHs, HLs, and HHs.  If you can figure out when to enter (because the HL can form at any point), you can make money as long as you get out before price goes against you.  Be careful adding to winning trades because as soon as that retracement goes a bit too far, your winning trade can turn into a losing trade.

Sometimes price makes LL, HH, LL.

Sometimes price makes HL, LH, HL.

Price can do whatever it wants and doesn’t care what it has done in the past.

You will see people chime in on these kinds of discussions and say “well obviously you just don’t understand it” subtly implying that they do understand it, yet you will never see them make real time calls.  I wonder why?

Price can go wherever it wants, and unless you know ahead of time that it’s going to make a LH or whatever, there’s no way to know that a HL will follow a HH.  Here is a list of possible formations that can follow a HH:

– HL

– DB

– LL

(obviously a LH can’t follow a HH because a LH is formed when price is rising and if you’re already at an HH you can’t have a LH without some sort of low coming first).

Here’s a chart showing what can follow what.  Start with the vertical column and go across to see if a certain formation can follow it.

high low table

This is a very active topic and I will likely revisit it in the future.

I encourage your comments and discussion about how to use HH/HL/LL/LH/DB/DT in your trading.

How I Trade As If Price Is Random – Part 3

(continued from part 1 and part 2)

My original method, the one used in my journal thread, was based on Fibonacci retracements. Keep reading before you flame me: I don’t think Fibonaccis are special, and I joke about people who think they have magic powers.I do not believe that a 38.2% retracement is really any fundamentally different than 38.1% or 38.3%, or 43.6%, or 19% or 39.4%, or any other number. Literally any number will work just as well because, say it with me, price is random. Do you think price goes “hey, this is a 38.2% retracement! Time to go the other way now!” No. And do you think the market makers do that?

I do not believe Fibonacci numbers are special. I know that some people are pretty serious about using Fibonacci number tick or volume charts as if the Fibonacci number is somehow magic and will work better than any other number. That’s all nonsense.

When I first shared my method elsewhere a few years ago, the discussion quickly turned into an argument between people who think that because Fibonacci numbers may sometimes be found in nature, they are therefore applicable to trading, and the people who think that’s a bunch of crazy talk.

I decided to share this method because of a few conversations I had been having with people who were paying a monthly fee to some “guru” to learn how to trade with Fibonaccis. None of them were making any money (other than the “guru” who was collecting monthly subscriptions), and the thing I noticed is that these “gurus” were always extremely vague.

They would post after the fact charts where price happened to bounce off of a Fibonacci level and say “see?! Fibonacci retracements work!”

The gullible students would say “wow u r so smart! Here pleez take my money to teach me!”

But the people who had more accurate BS detectors see that that is all nonsense. Without knowing ahead of time if price was going to bounce off a Fibonacci level, and if so, which one, such a method is useless.

I originally used two methods: one for daytrading the ES, and one for long term trading SPY (or SSO). The daytrading system is much crazier and I will talk about it later. Since I don’t daytrade regularly anymore, let’s just talk about the longer term system.

This is a long term system so we’re using daily charts.

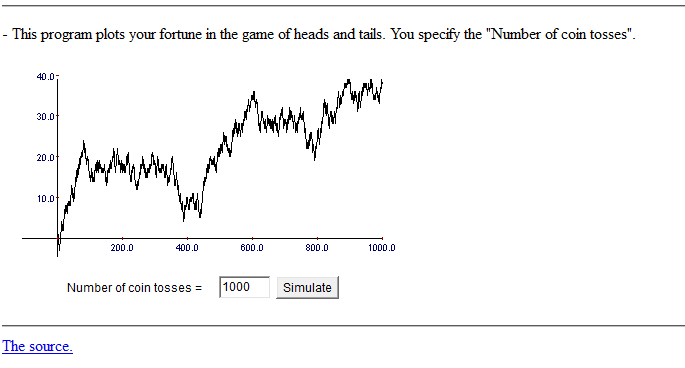
The general idea is that since price is random, we know that it goes down and up, but we don’t know when it’s going to either, nor for how long. We do know that it can’t go to negative, and we have a pretty good chance that the S&P will not go to 0.

Do not use margin. You are going to be averaging down quite often. Using margin is a good way to blow your account when SPY goes one penny further than you can afford. If you do not use margin you cannot blow your account.

The initial profit target will be the previous high. Depending on how far your position goes against you, you may wish to change the target in the future (for example, if you start buying SPY at 140, and it eventually drops to 90, you might not still want to have to wait for it to get back up to 140 before you close your position).

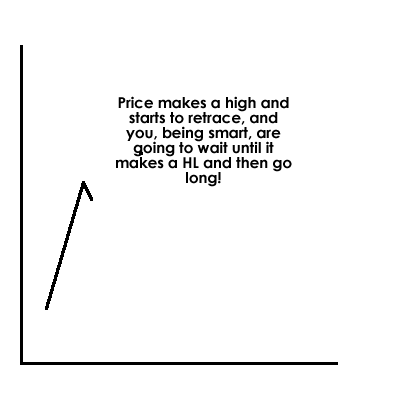
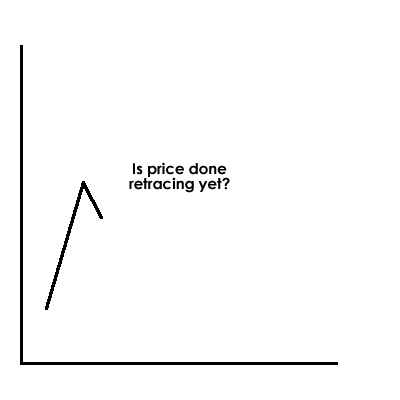
Step 1: Wait for SPY to make a pullback. You can use Fibonacci retracements if you want. I did for the sake of proving the point that Fibonaccis can be traded profitably but it really doesn’t matter. You can use 25% increments, you can use 30%, or 42%, or 51% or anything you want. There are no magic numbers. When price has pulled back to your level, buy a small amount.

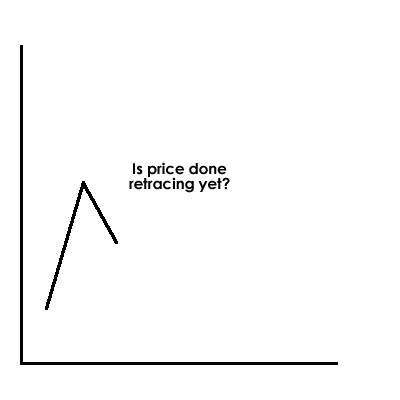
Step 2: Buy more SPY when it goes against you another predetermined amount (perhaps the second Fib retracement, perhaps a random percentage, etc).

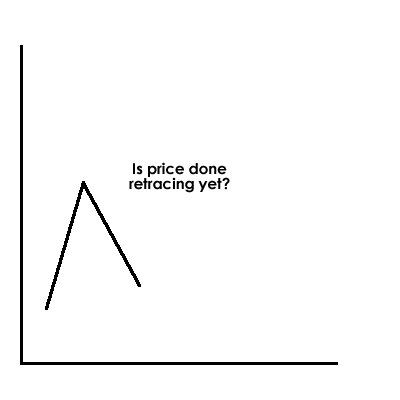
Step 3-x: Continue to buy more SPY when it continues to go against you. Again, you can use Fibonaccis, or you can divide its current price into increments (such as if SPY is at $140 and you buy every time it drops $10), or into percentages (such as if you buy every time it drops a certain percentage), etc. Remember that each add is going to be bigger than the previous. This is averaging down. Remember that you are not using margin. Begin your first add with a small enough size that you can continue to buy more as it goes against you. If SPY is $145 and you keep buying all the way down to $100 and then run out of money and then SPY goes down to $80, you did it wrong.

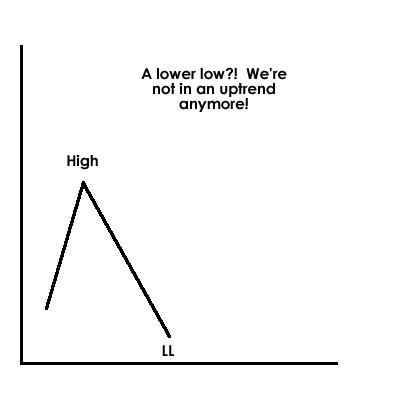
Remember, price is random so you have no idea how far it’s going to go down.

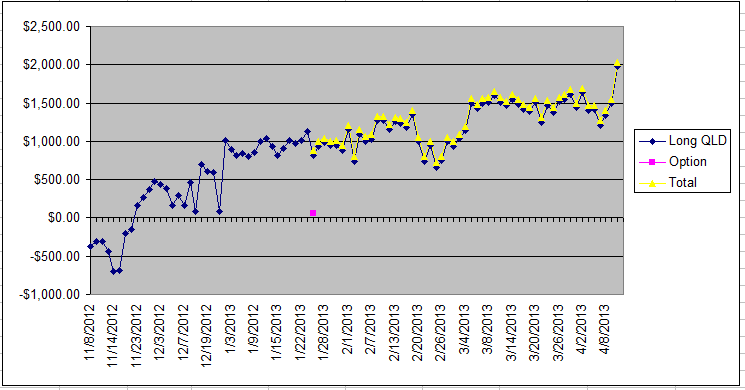
Some of the trades will be awfully slow and boring. I currently have a trade in QLD that has been open since November of 2012 and has barely gone anywhere. I didn’t know QLD was going to chop for a few months when I bought it. Patience, remember. Not every trade will end up in a huge winner. Some of them will just be small winners.

Ok I’ve been spending a few hours writing this now and need to take a break. There is much more to discuss, including:

– hedging a SPY position with SH to make money when your SPY position is drawing down
– uptrends and random entries
– using covered calls in slow boring uptrending markets

And some more rules to be discussed, such as why I never add to a winning position.

And now to preempt some of the inevitable questions and criticisms:

1) “Dude you are so dumb, this isn’t trading.”

Well, I’m making money buy buying and selling stocks, so yeah, it is trading. And I’ve been consistently doing so for years with every trading posted in real time, so… yeah.

2) “This system sucks and doesn’t make money in big up trends. That’s when all the big money is made. I know because some “guru” told me so. You would know that if you were a real trader. Trend following for lyfe!!1!1!!!!”

Yeah, I don’t make much in big up trends unless I happen to have a big position from a previous downtrend. That doesn’t always happen. But I also don’t have big losses following downtrends the way most people do. And when price goes up and down I do pretty well.

3) “You idiot, you are basically just throwing a lot of money at the market and when it eventually rebounds, you make money.”

Yup. Since I cannot predict price, this is how I have to do it. I view the markets as a mathmatical random sequence rather than whatever you view them as. If you were going to make money from a random sequence, how would you do it? Averaging down, that’s how.

Look, this is not everyone’s holy grail. Sometimes it works very well. Sometimes it doesn’t produce big winners.

If you can predict price, keep doing what you are doing. If I could predict price I would just enter in the correct direction with my entire account on each trade. There would be no reason to start small and add more as price goes against me.

I fully admit that this method is inferior to price prediction methods. But I’ve never seen anyone who could successfully predict price, and until I am able to do so myself, I will continue to trade this way.

To give you an example of a complete trade that lasted a whlie, on October 27, 2011, I closed out a trade that had been open for a while. This was the previously mentioned trade that at one point was drawn down over $60,000. On October 31, 2011, the dividend was paid and the final numbers looked like this:

SPY: $31,115.00 (closed)
hedge: -$3,281 (closed)

$27,834.00 (SPY gain + open hedge loss)
$1,223.60 (realized hedge gain)
$2,931.69 (realized hedge gain)
$1,129.72 (dividend)
$3,562.22 (dividend)
$5,221.55 (realized hedge gain)
————————
$41,902.78 (total for trade)

I had a SPY position which I had been continually adding to, several SH positions that had been closed and reopened, two dividend payments, and a currently open SH position that was closed at a loss.

That’s how I trade as if price is random.

How I Trade As If Price Is Random – Part 2

(continued from part 1)

Let’s talk account size for a bit. This is not to brag, but just to paint a realistic picture of where I’m at. This style of trading is not going to be feasible if you have a $5,000 account.

Ever since college I have been very frugal and tried to live below my means. This isn’t meant to be a financial lesson, but just because your salary increases doesn’t mean your expenses have to increase. I’m sure you’ve all read “The Millionaire Next Door” and that type of books (if not, read it. Cliffs notes: rich people are frugal, poor people are flashy).

This is especially true in trading. If you have a normal salaried job, you know that every week you will get paid $500 or $1,000 or however much you make. Although your salary may be limited, it still allows you to plan for future expenses. If you own your own business (trading is included in this) then this is all uncertain. You may make $10,000 one week but that doesn’t mean you won’t make $0 the next week. Or -$10,000.

Being frugal helps ensure your survival.

Lesson over, back to trading.

Let me back up even further and say that the reason my account is where it is today is because during the “recession” of 2008, I averaged down heavily into weighted index funds (QLD, SSO). This is already breaking two “rules” that traders love to quote: 1. don’t average down, 2. don’t use weighted ETFs long term.

Everyone else was freaking out and selling. “Oh noes, the economy is collapsing!”

No it’s not.

It hit me that this could be a great buying opportunity. My first thought was to buy as much SPY as I could afford, but then I learned about the weighted ETFs which were not only cheaper per share, but also double weighted, so for example, if the S&P 500 goes up 1%, SSO goes up 2%.

I picked the indexes because I had no idea what would happen to individual stocks but I was pretty confident that the indexes would not go to zero, and if they did, I had bigger problems than blowing my account.

While I watched everyone on the forums talk about the collapse and how they were selling, I just continued buying more every time it dropped a certain %.

“Be greedy when others are fearful.”

I can’t predict price direction, but I was pretty sure those funds would go back up.

So, remember when I said I regularly break commonly-accepted trading rules?

What is it, 95% of traders lose? And they all probably follow those rules.

– Never add to a losing position
– Never let a winner turn into a loser
– Never risk more than 2% of your account
– The trend is your friend

Let’s talk about those:

– I regularly add to losing positions. I do it within certain boundaries, never with margin, and never with risk of blowing my account.

– My winners often turn into losers. I have no idea if price is going up or down. Sometimes they go against me.

– My drawdown sometimes goes well past 2% of my account.

– Every trade I make is counter-trend.

“The trend” is a bunch of nonsense and is a great topic for another post. Let me summarize it like this:

– price can reverse at any point and the “trend” only exists in hindsight. Just because whatever trend identification method you use (MA slope, higher highs/higher lows, whatever) happens to say “hey, we are now in a trend whereas one tick prior to this we were not in a trend” doesn’t mean price is going to keep going in that same direction.

(continue reading in part 3)

How I Trade As If Price Is Random – Part 1

I also posted these on the excellent forum traderslaboratory.com.

Let me start by saying this style of trading is not for everyone. I expect a lot of criticism and people to tell me I’m doing it wrong. I pretty much break every trading “rule” in every trade. More on that later.

Let me also say I’m not selling anything nor am I a vendor, nor do I accept “donations.” This is all free for the sake of discussion and creative thinking. I have a website and a Twitter account but there’s nothing for sale on any of those, either, and all I really do on them is call trades and write about how to avoid trading scams. No one is going to steal my edge and prevent me from making money unless they somehow manage to make the market go up forever without ever retracing in which case my retirement accounts will thank them.

Let me start by talking about my “edge.” I hate that word because it gets thrown around all the time on the forums by people who don’t always know what it means (the same people who calculate risk/reward after the fact).

My edge consists of:

Account size – I know there are stories of people starting with a $10,000 account or whatever and building it up to $1M. I’m sure that’s possible if you can predict direction, but I can’t, and this is not one of those stories.

Discipline – I don’t have trouble following rules. I’m also patient. Some of you may have been following my journal thread for the last few years on another big trading forum where I’ve posted live calls for every trade and remember a point when I was sitting on around -$60,000 of drawdown and everyone was telling me I was doing it wrong and I should close the trade before it gets any worse and etc. I didn’t care. I sat through big drawdown for a while, collecting dividends and profits from hedging the other side (more on that later) in the process, and ended up closing the trade for over $40,000 in profit. This was all posted in real time with daily updates, and that forum doesn’t let you edit old posts so I couldn’t change anything if I wanted.

Good thing I didn’t listen to those people who told me I was doing it wrong.

Patience – I know that there are some times when I won’t have any trades. Sometimes the market just slowly trends upward over time and I don’t make very much money. I don’t care. Focus on the big picture.

Money management – I never use margin. I plan entries and exits ahead of time. I know how to hedge the other side. I never use margin. Also, I never use margin.

Knowing what I don’t know – I cannot predict price. I’ve studied every indicator, I’ve reverse engineered some of the popular ones, I’ve created my own. All useless. I’ve studied price action. I’ve studied volume analysis. I am still studying these things in my spare time but currently am still unable to predict direction, but maybe one day I will.

But until that time, I’ll continue to trade the way I do, having no idea where price is going tomorrow, only knowing that it’s going to go up and down.

(continued in the part 2 and part 3)

Everyone Is Going Crazy About Bitcoin and Litecoin

There has been a lot of news recently about Bitcoin (BTC) and Litecoin (LTC).

If you’re not up to speed, Bitcoin is a virtual currency that you can use to buy real things in real life.  There are many other websites that explain it in more detail, but as a virtual currency you can trade it the same as any other currency.

It’s been in the news recently because a few days ago there was a huge rally followed by a huge drop.  Here’s a 6 month chart courtesy of bitcoinity.org:

btc 6 month chart

You can see that 6 months ago Bitcoin was trading around $10 and last week it reached over $250 only to drop so much in one day that they actually halted trading, and then continue to drop to its current price (as of this writing) of $65.  This got a lot of people interested who hadn’t even heard of BTC until a few days ago.

Litecoin (LTC) is a similar virtual currency, albeit one that is trading for much less, as you can see from this chart from cryptocoincharts.info:

ltc 1 year chart

For most of the last year it was well under $1, and then in the last week or so it ran up to a high of almost $6 and has now dropped to just under $2.

I am staying away from virtual currencies for now.

Why?

It has less to do with how viable I think they are as a legit form of currency and more with what a pain in the butt it is to work with them.

You may find that you’ve spent hours online reading about Bitcoin, Litecoin, and other virtual currencies, but realize you still have no idea how to actually invest in them.

Here’s roughly how it has to work (as of now):

First you need to find an exchange that lets you trade the instrument you want to trade.  You can’t trade them at your normal brokerage, instead you need to find a site like MtGox or BTC-E and trade there.  You may notice that difference exchanges have different prices for the same virtual currency.  This is because it’s not centralized, and yes, there are arbitrage opportunities.

So you’ve found an exchange, the next thing you have to do is open an account and get money into it.  How do you do that?

Well, you need something called an eWallet to store your Bitcoins.  It’s basically a file that stores proof that you have the Bitcoins you have (the way this works is more complicated than I want to get into, so Google it if you want more info).

So how do you get money in your account so you can buy Bitcoin and put them in your eWallet?

You can’t use your credit card (chargebacks would screw over the seller).

You can’t necessarily use PayPal (not that you would want to with their huge fees, anyway).  There is one option where you can but there’s like a 9% fee.  More on this later.

BTC-E is one such exchange that lets you trade Bitcoin, Litecoin, and a few others.  You can fund your account with a few online money-sending companies, one of which is in Russian, and the rest of which, well, you probably haven’t ever heard of them.

MtGox is another one that only lets you trade Bitcoin, but they are the biggest Bitcoin exchange on the internet, and have a few more options including a bank transfer.

There’s another option to fund your account called BitInstant.  See, most funding options take forever.  If you’re anxious to start trading today you don’t want to wait 5 days for the funds to end up in your account.  BitInstant has a bunch of funds on reserve that they immediately transfer into your account after you pay them, and they take a small fee for the convenience.  Unless you use PayPal, of course, in which case they take a 9% fee.  It’s a clever idea, and they claim to have the funds in your account within hours, but due to the recent surge in BTC interest (and increase in BitInstant demand), there are reports on various forums of people still having to wait days with BitInstant.

There are other exchanges, but MtGox and BTC-E are probably the two most well known.

There’s also the issue of security.  Some exchanges have been hacked.  Some eWallets have been hacked.  Some of these companies repaid their customers, which shows integrity.

Are you confused yet?

Basically, Bitcoin and its ilk only exist online, and you have to go through multiple websites to even fund your account.  Many of these websites are not even US-based, and if for whatever reason your money never shows up in your account, who are you going to report it to?

Virtual currencies may end up being a very big thing in the future.  After all, you can already buy some things with Bitcoin the same as you can with cash.  And if you get in now at the ground level you may end up with some useable currency in the future.  But I basically don’t trust any of the associated websites, and that’s nothing against them necessarily, it’s just my paranoia.  And it also seems like quite a hassle to actually fund your account.

I do know people who have traded Bitcoin with MtGox and had no problem whatsoever.  In fact, the statistics favor you having no problems whatsoever.

But I’m gonna sit tight for a while.

Prices may actually rally again in a few days when the people who just heard about it a few days ago finally get their accounts funded and start buying.

April 15, 2013 – Why I’m Buying 3x Weighted Silver (USLV)

As I posted on my Twitter feed this morning, I picked up some USLV (3x weighted silver) this morning at $10.81.

If you haven’t seen, gold and silver have both fallen over 10% in the last two days:

slv longterm

I am averaging into my position in silver because as you know, I cannot predict direction and I have no idea when the bottom will be.

I decided to use USLV instead of SLV because it’s much cheaper per share and also because it’s weighted 3x.  This means that for every 1% SLV moves, USLV will move 3%.  It’s more risky, but I’m using less capital. Look how much USLV has dropped relative to its recent highs compared with SLV:

uslv

Here’s a chart of the last 11 months showing SLV (silver), AGQ (2x weighted silver), and USLV (3x silver):

uslv slv agq

I will continue to buy as it drops further until it starts going back up.  Please note that I only do this for instruments that I believe are going to recover, such as the indices and silver.  You’ll notice that I never do this for individual stocks because you never know when a stock is going to go to zero.

Just like when I was heavily drawn down in my SPY position about 1.5 years ago, I am not worried.  I think silver will go back up.  Stay tuned for my future buying positions.

Is Price Movement Actually Random?

Take a look at this chart.  I’ve labeled some of the technical patterns that you might identify:

chart with patterns labeled

You can see a double bottom as price tests support and then rallies up to a previous level of resistance.

You can see price bounce off that previous resistance and then continue upward, and then come down and retest that same level, bounce off as it flips to support, and then continue upward again.

You can see a period of consolidation after a new high where it just kind of chops around for a bit, then breaks through to the bottom, bounces off that new support level, goes back up and is currently forming a triple top at a new resistance level.

A trader armed with this knowledge who can identify these patterns should be able to make some money, right?

Well, I hate to tell you this, but this is just a random chart that was generated by 1,000 coin flips.  Heads is +1, tails is -1.  The only change I made was to move it over to the left a little bit so it didn’t start from zero, since no stock ever starts from zero.

1000 coin flips

You can try it yourself here.  Obviously some of the results won’t look like stock charts, especially the ones that go negative, but run it a few times and you should get some good ones.

Are you being fooled by randomness?