March 16 2010 Trades

Only one trade today, 4 contracts deep.

Today’s price action was boring. There was really only this one pullback on the 2500 tick chart. I may have to switch to volume charts or something. 2500 tick was kicking ass last week but it was boring today.

3-16-2010 pnl


Total for the week: $1,791.70.

March 12 2010 Trades

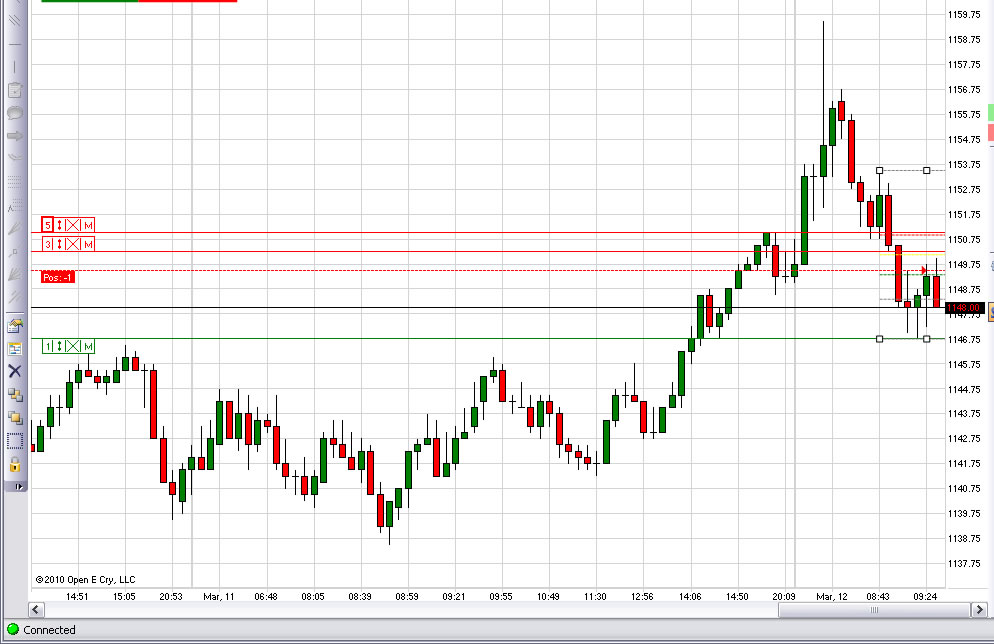
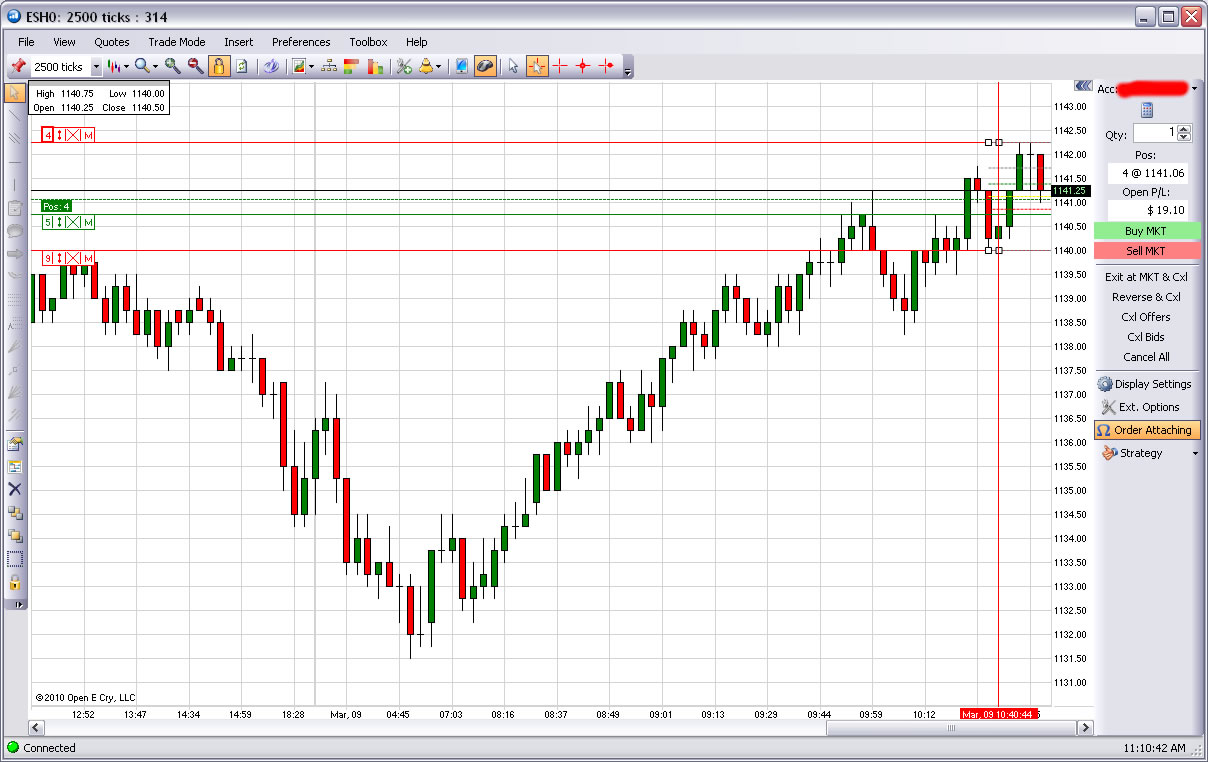
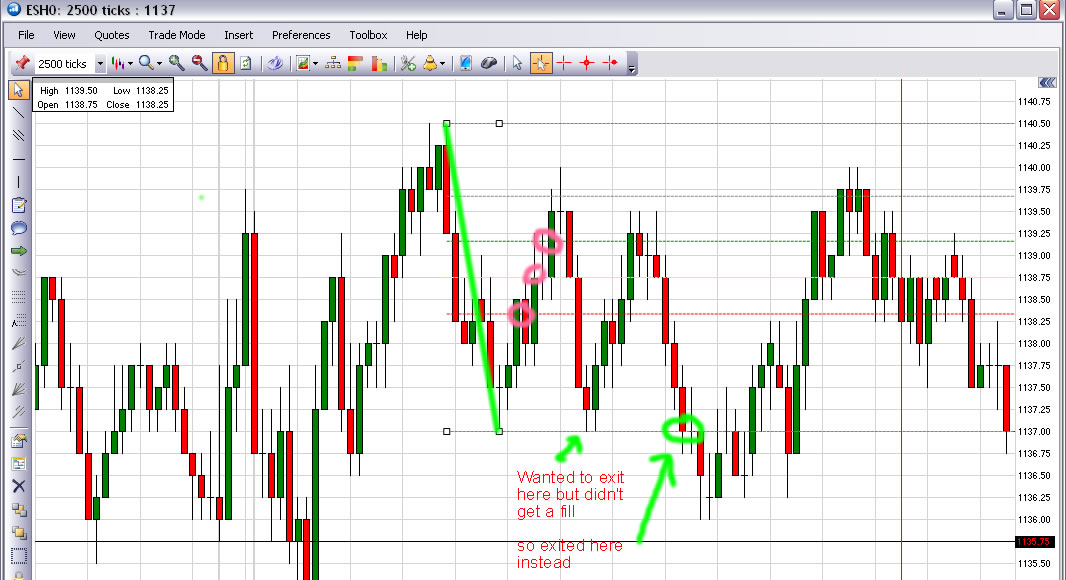
Live pic of my first trade today.

Target profit is 1145.75. Stop Loss is 1153.50 but I haven’t put in that order yet, as you’ll see, cuz I’m still at the first level of the trade.

3-12-2010 trades

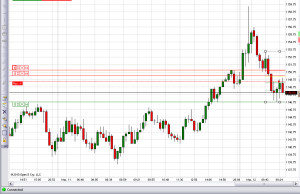
I’m about to cut this trade early because I have to go somewhere soon and I’m going to be gone for the rest of the day. Price hasn’t moved much since I entered, but I’m now the full 9 contracts in (short) with an average price of 1150.58.

Price is currently at 1148.75 so that’s almost 2 full points with 9 contracts = almost $900 profit.

4.75 points away from the stoploss which would be a loss of $1300. So if I let this trade run, it’s going to be either a profit of about $1700 (minus commission) or a loss of $1300 (minus commission).

Screw it, I gotta run. Trade ended early, got a bad fill, out at 1149.50.

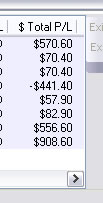
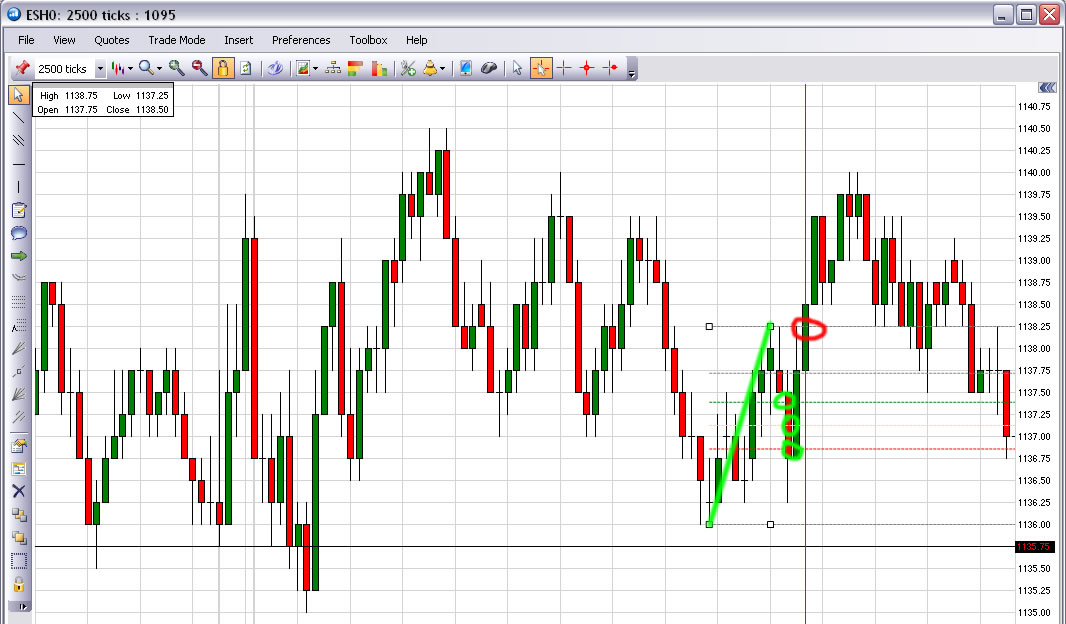
Avg Buy Price: 1149.50
Avg Sell Price: 1150.58
9 contracts

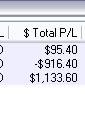
$486 before commissions
$444.60 after commissions

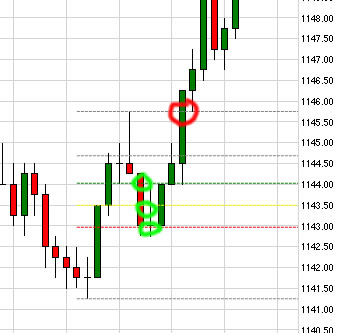
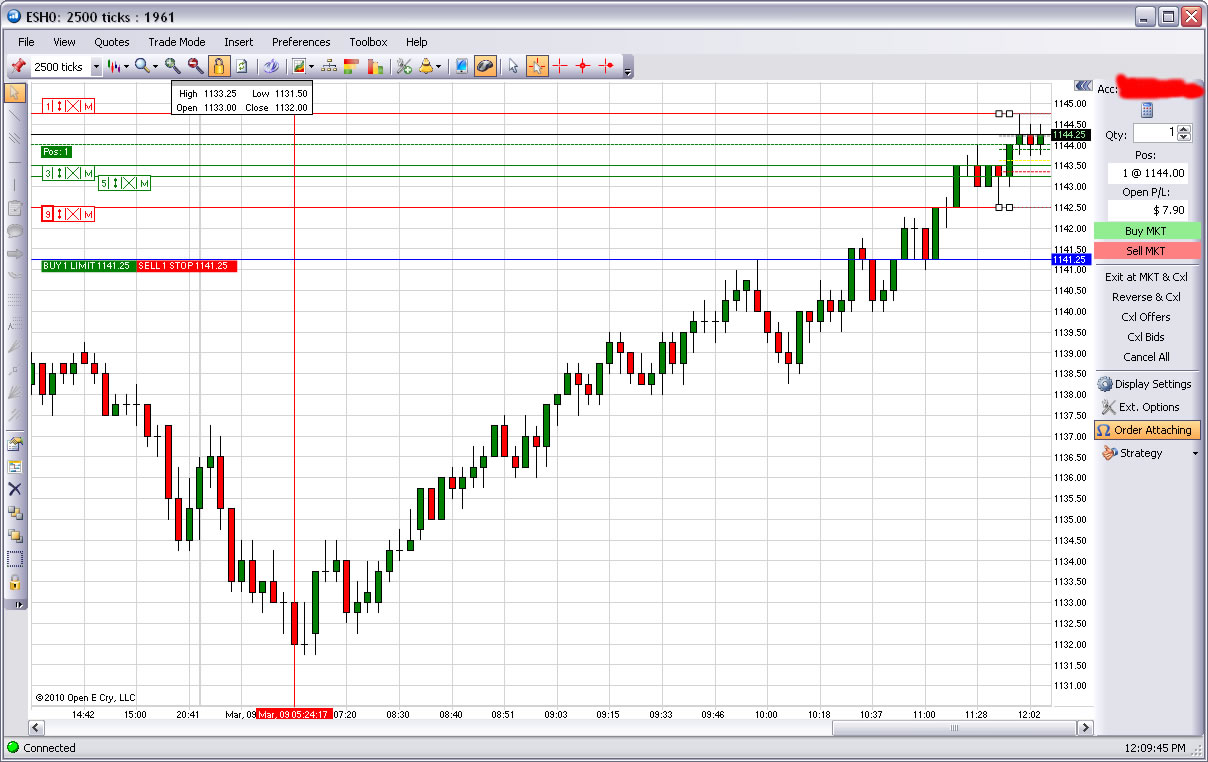
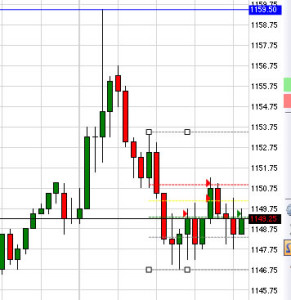
Here’s a pic of the trade after it was closed. The 3 red arrows are where I entered short, and the green arrow is where I closed the trade just now.

3-12-2010 trade 2

$5,386 profit for the week.


March 10 2010 Trades

May be about to have my first losing trade this week.

Basically if the ES hits 1145.75 before it hits 1148 I’m gonna lose this one.

I’m in 9 contracts deep now.

I’m not sure why the order arrows aren’t showing on this pic. Sometimes OEC turns them off and I have to go into settings and turn them back on. It’s annoying.

March 10 2010 trade

8 trades today.

9 contracts on the 1st (win)
1 on the 2nd (win)
1 on the 3rd (win)
9 on the 4th (loss)
1 on the 5th (win)
1 on the 6th (win)
4 on the 7th (win)
9 on the 8th (win)

3-10-2010 pnl

March 9 2010 Trades

Here’s a live trade I have on right now

I have 4 contracts currently open (1 at the first retracement and 3 at the second retracement = 4 total) with 5 more ready to be purchased if price goes down to the next retracement. An exit order sitting at 100% retracement with 9 contracts (which is how many I’ll have if price retraces that far) and my target profit order with 4 contracts (how many I currently have) sitting back up at the 0% retracement line. Obviously I change the quantity there depending on how many contracts I have open.

march 9 2010 trade

And another open trade:

march 9 2010 trade 2

Today’s PnL. 3 trades today, 2 of which I posted above when they were live.

The first trade ended up being 9 contracts, 4 on the second, and 1 on the last.

There were a few more trades that I almost entered but price didn’t retrace enough to the magical fib lines so I never entered.

3-9-2010 pnl

March 8 2010 Trades

Ok sorry about this but you’re getting the MS Paint version today because my computer isn’t cooperating today.

First trade:

I drew a green line where the fib lines were drawn. It was the down swing this morning. The red circles are sell shorts, and the green circle is the cover.

First trade:

march 8 2010 trades

Second trade:

In the same downswing that closed out my first trade, price went back up and then retraced again so I started buying (green circles) and sold when it went back up to the 0% line (red circle).

You’ll see price went up to 1140 to make an afternoon high and then started to retrace down. I ended up NOT taking a trade here because it was already getting to be late in the afternoon and I thought that the range of this last swing was so large that I didn’t think price would have enough time to make it back up to the top before the market closed. Lucky for me I didn’t take it because I would’ve had to close my trade out for a loss as the market closed.

march 8 2010 trades 2

Today’s PnL.

march 8 2010 pnl

March 5th 2010 Intraday Trades

Today’s Trades.

There weren’t many places today where price actually retraced to one of the fib lines, but I finally got a small retrace so I entered. The problem with doing these narrow-range trades like this is that the fib lines often don’t match actual prices where you can buy. You can see the red fib line is at like 1133.33, but obviously you can’t buy the ES there.

So in most cases, when this happens, I put the buy order under the line at the closest valid price (to get a little better price than if I put it above the line). That’s why the green arrows (buys) don’t line up exactly with the fib lines.

Shortly after closing out this trade, I got disconnected from OEC for a few moments. It instantly reconnected, but I was hesitant to take any more trades for the rest of the day.

3-5-2010 trades

PnL for the day.

9 contracts total in that one trade, but I averaged down, I didn’t do 3, 3, 3.

3-5-2010 pl